Combination IELTS Task 1 (Academic) #259: Combination
CombinationFull IELTS Academic Task 1
You should spend about 20 minutes on this task.
The graph below shows CO2 emissions for different forms of transport in the European Union. The Pie Chart shows the percentage of European Union funds being spent on different forms of transport.
Summarize the information by selecting and reporting the main features and make comparisons where relevant.
Write at least 144 words.
Sample Answer:
The provided illustrations represent the amount of CO2 emissions produced by various transportation modes within the European Union, and the allocation of EU funding towards these transport sectors.
A general observation of the data reveals that cars are the primary source of CO2 emissions, while the majority of EU funding is invested in railways. However, there is a stark contrast between the CO2 emissions and the proportion of funds allocated to different transport modes.
In terms of CO2 emissions, cars are the largest contributors, emitting approximately 60% of the total CO2. This is followed by trucks, which account for roughly a quarter of the emissions. In contrast, the emissions from airplanes, buses, and motorcycles are relatively low, with each contributing less than 10% to the total emissions.
On the other hand, the EU funding allocation is quite different. Railways receive the lion's share of the funding, with over half of the total budget. This is followed by roads, which receive about a third of the funding. The remaining funds are distributed among air and sea transport, with each receiving a small fraction of the total budget. Despite being the largest contributor to CO2 emissions, cars do not receive any direct funding from the EU.
More Graph Tasks
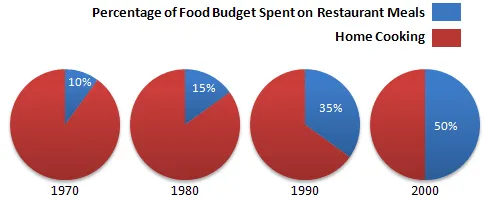
Restaurant meal spending and fast food consumption
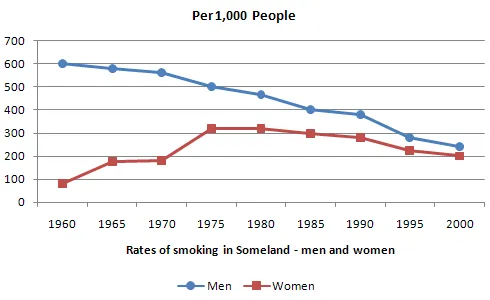
Smoking rate in Someland from 1960-2000
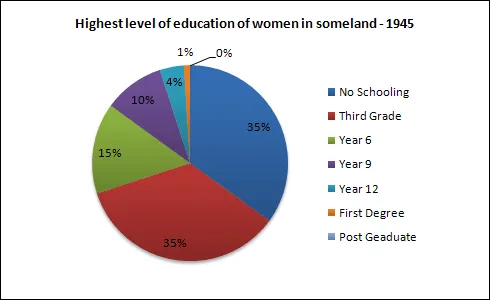
Women's education levels in Someland 1945-1995