Line Graph IELTS Task 1 (Academic) #174: Line Graph
Line GraphFull IELTS Academic Task 1
You should spend about 20 minutes on this task.
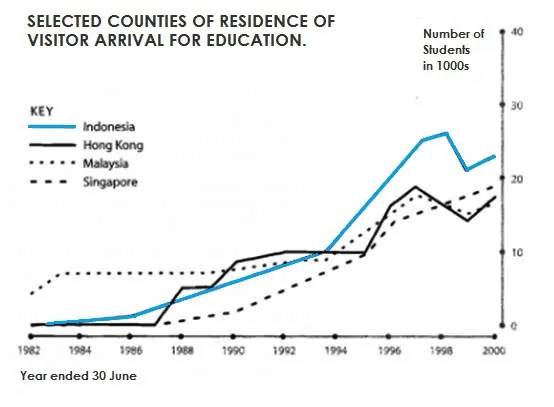
The graph below shows four countries of residence of overseas students in Australia.
Summarize the information by selecting and reporting the main features and make comparisons where relevant.
Write at least 169 words.
You should spend about 20 minutes on this task.
The graph below shows four countries of residence of overseas students in Australia.
Summarize the information by selecting and reporting the main features and make comparisons where relevant.
Write at least 169 words.
Sample Answer:
The line graph illustrates the number of international students from four different nations studying in Australia over a ten-year period from 2000 to 2010.
At a glance, it is clear that all four countries saw an increase in the number of their students studying in Australia, with one country experiencing a particularly dramatic rise. Additionally, there were significant fluctuations in the figures for all four countries throughout the decade.
Looking at the details, in 2000, the number of students from India was the lowest at around 20,000, but it experienced a sharp increase, peaking at 100,000 in 2009, before dropping slightly in 2010. The number of Chinese students also rose steadily from 10,000 in 2000 to around 90,000 in 2010.
In contrast, the numbers of students from Malaysia and Singapore were relatively stable, with only slight increases. The number of Malaysian students rose from roughly 30,000 in 2000 to just over 40,000 in 2010, while the number of Singaporean students increased from approximately 40,000 in 2000 to around 50,000 in 2010.
More Graph Tasks

Product lifecycle environmental issues diagram
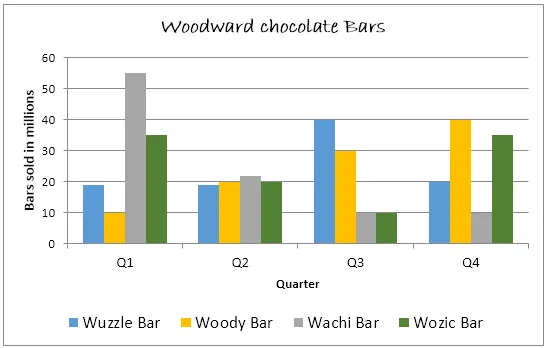
Woodward chocolate bars quarterly sales 2010
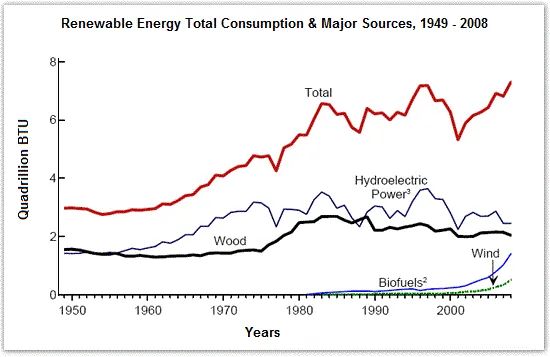
USA renewable energy consumption 1949-2008